Clear Rates
Scaling up logic from Sample Reviews to identify provider-payer-networks where we were able to successfully infer a Medicare Advantage percentage of Medicare.
Top Results:
Estimates of number of providers per payer where we can infer a Medicare Advantage percentage of Medicare.
| payer_id | provider_id |
|---|---|
| 643 | 1256 |
| 510 | 1172 |
| 7 | 1168 |
| 76 | 655 |
| 706 | 532 |
| 42 | 422 |
| 277 | 401 |
| 522 | 162 |
| 19 | 143 |
| 354 | 130 |
| 388 | 111 |
| 169 | 109 |
| 1150 | 102 |
| 723 | 101 |
| 1107 | 100 |
| 1110 | 98 |
| 174 | 96 |
| 1208 | 86 |
| 796 | 73 |
| 143 | 71 |
| 111 | 71 |
| 911 | 70 |
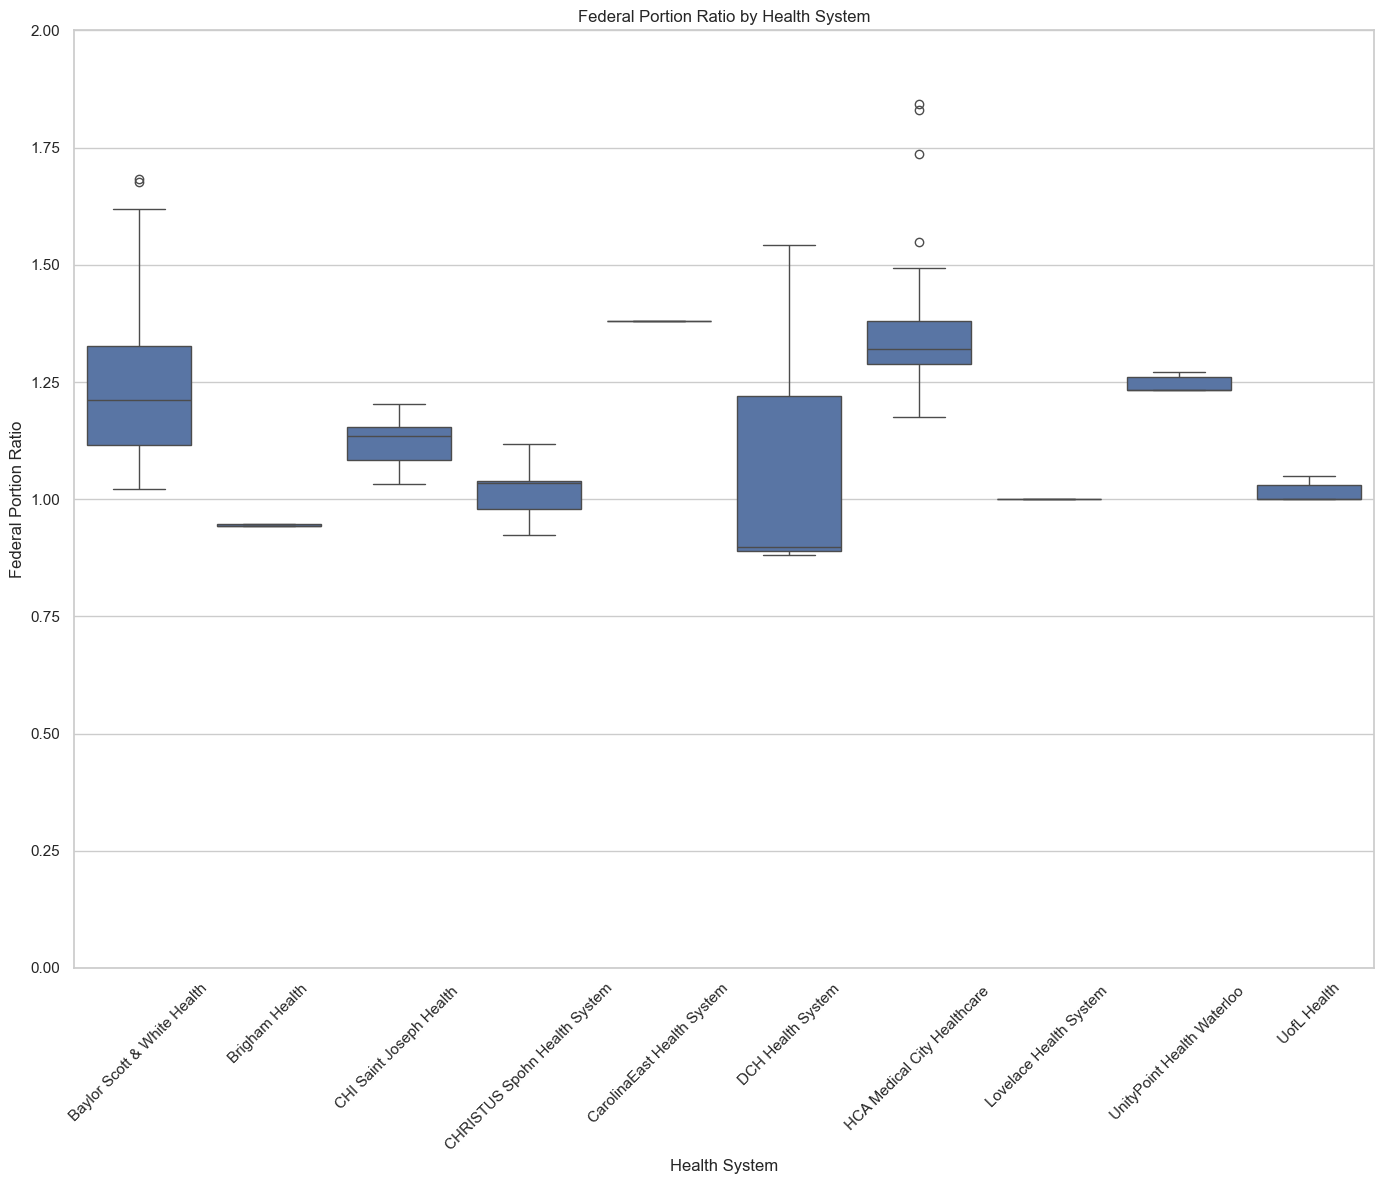
Federal Portion Ratios (% of Medicare)��
By Payer (top 10 by MA coverage)
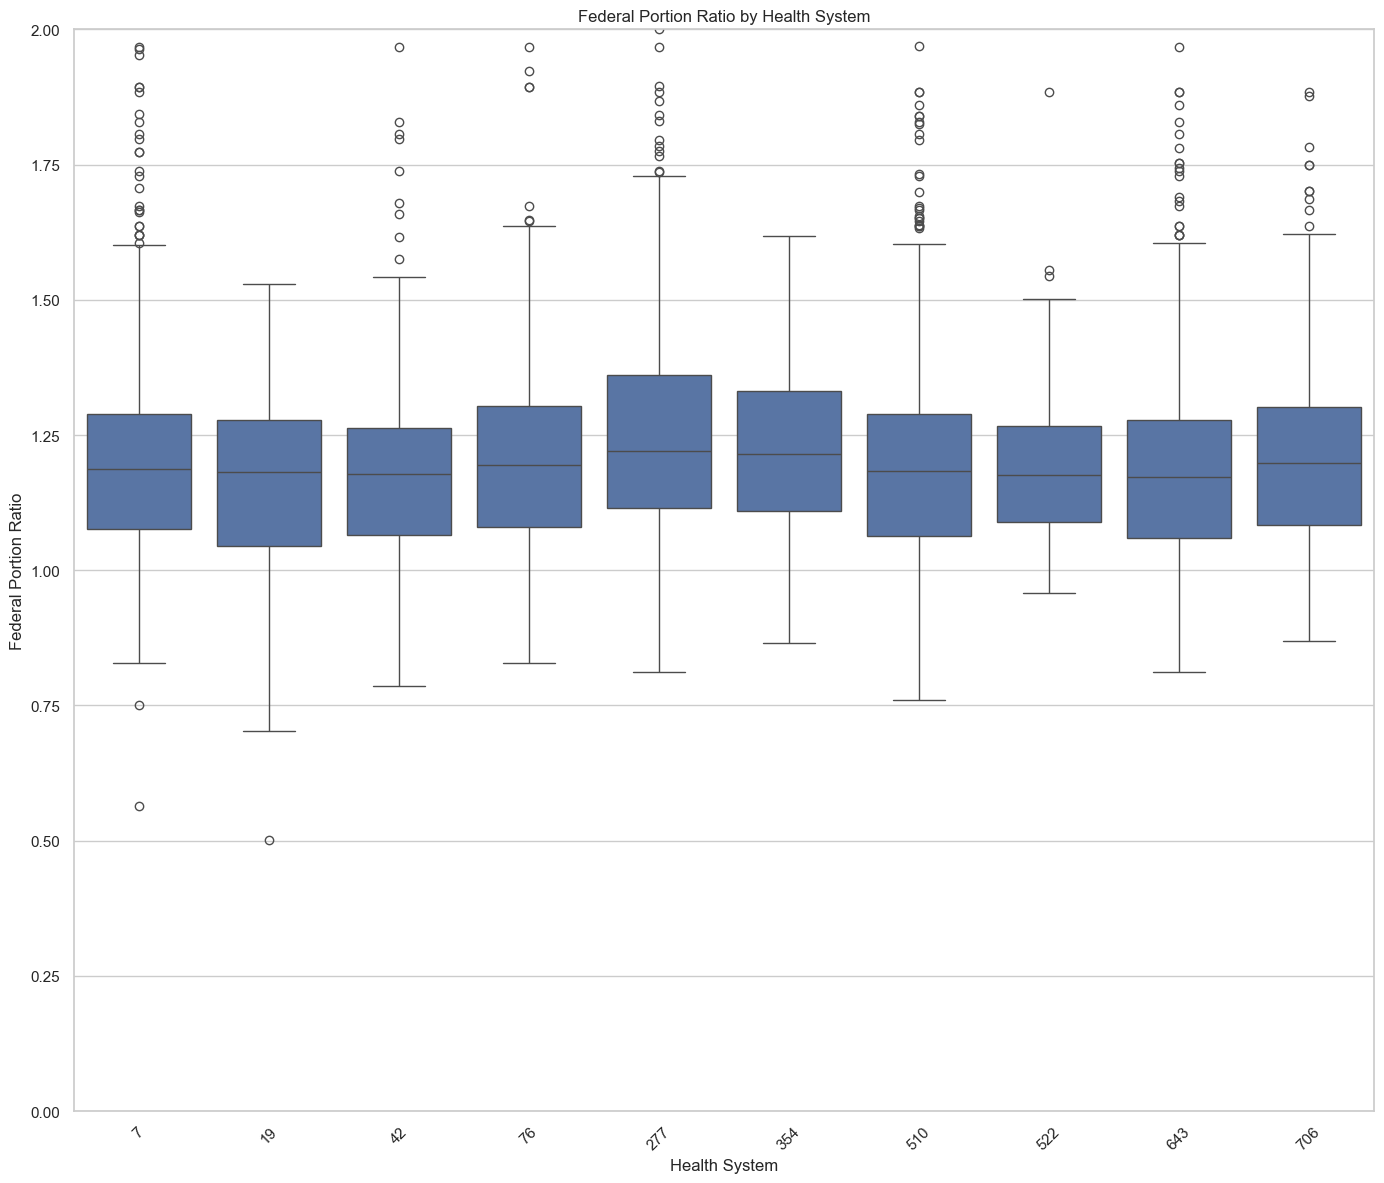
By Health System (10 random samples)
Code
# %%
from IPython import get_ipython

if get_ipython() is not None:
    get_ipython().run_line_magic("load_ext", "autoreload")
    get_ipython().run_line_magic("autoreload", "2")
from dotenv import load_dotenv
import pandas as pd
from tqds.sql import db, sql

import pandas as pd
import numpy as np

pd.options.display.max_columns = None
pd.options.display.max_rows = 100
pd.options.display.max_colwidth = None
pd.set_option('display.float_format', lambda x: '%.3f' % x)
trino_conn = db.TrinoClient().conn
redshift_conn = db.RedshiftClient().conn
query = sql.Query()


# %%
df = pd.read_sql(f"""
-- 🍙🍙🍙
WITH
provider_payers AS (
    SELECT
        hr.*,
        negotiated_percentage * gross_charge AS perc_to_dol,
        h.provider_name_short,
        phs.provider_id AS provider_healthsystem_id,
        phs.provider_name_short as provider_healthsystem_name
    FROM glue.hospital_data.hospital_rates hr
    JOIN tq_production.spines.spines_provider_hospitals h
        ON hr.provider_id = h.provider_id
    JOIN tq_production.spines.spines_provider_healthsystems phs
        ON h.provider_healthsystem_id = phs.provider_id
    WHERE hr.payer_class_name = 'Medicare Advantage'
    AND COALESCE(hr.billing_class, '') != 'Professional'
    AND hr.billing_code_type = 'MS-DRG'
    AND payer_id != 12
),
medicare AS (
    SELECT DISTINCT
        fy,
        msdrg AS billing_code,
        weights
    FROM tq_intermediate.cld_utils.msdrg_weights_by_year
),
combined AS (
    SELECT
        pp.*,
        m.*,
        1.000 * pp.negotiated_dollar / NULLIF(m.weights,0) AS base
    FROM provider_payers pp
    LEFT JOIN medicare m
        ON pp.billing_code = m.billing_code
),
medicare_rates AS (
    -- USE 863 since it has 1.000 weight in FY 2025
    SELECT provider_id, total_operating_and_capital_pay, federal_portion
    FROM tq_production.reference_legacy.ipps_reference_pricing
    WHERE
        msdrg = '863'
),
final AS (
    SELECT
        provider_id,
        payer_id,
        provider_name_short,
        provider_healthsystem_name as health_system_name,
        payer_name,
        CASE
            WHEN plan_name LIKE '%HMO%' THEN 'HMO'
            ELSE 'PPO'
        END AS network_type,
        fy,
        min(base) as min,
        APPROX_PERCENTILE(base, 0.10) AS p10,
        APPROX_PERCENTILE(base, 0.50) AS median,
        APPROX_PERCENTILE(base, 0.90) AS p90,
        max(base) as max,
        stddev(base) as std,
        ROW_NUMBER() OVER (PARTITION BY provider_id, payer_id ORDER BY stddev(base)) AS row_num
    FROM combined
    GROUP BY 1,2,3,4,5,6,7
),
spines AS (
    SELECT provider_id, npi
    FROM tq_production.spines.spines_provider_hospitals
)
SELECT
    f.provider_id,
    s.npi,
    f.payer_id,
    f.provider_name_short,
    f.health_system_name,
    f.payer_name,
    f.network_type,
    f.fy,
    f.min,
    f.p10,
    f.median,
    f.p90,
    f.max,
    f.std,
    mr.federal_portion,
    mr.total_operating_and_capital_pay,
    1.000 * f.median / mr.federal_portion AS federal_portion_ratio,
    1.000 * f.median / mr.total_operating_and_capital_pay AS total_operating_and_capital_pay_ratio
FROM final f
LEFT JOIN medicare_rates mr
    ON f.provider_id = CAST(mr.provider_id AS VARCHAR)
LEFT JOIN spines s
    ON f.provider_id = s.provider_id
WHERE row_num = 1
AND f.median IS NOT NULL
AND f.std < 1000
AND
    (
    1.000 * f.median / mr.federal_portion BETWEEN 0.5 AND 10
    OR
    1.000 * f.median / mr.total_operating_and_capital_pay BETWEEN 0.5 AND 10
    )
""", con=trino_conn)

# %%
df.to_excel('medicare_advantage_data_scaled_all.xlsx', index=False)

# %%
print(df.to_markdown(index=False))

# %%
df_summary = (
    df
    .assign(provider_network=lambda x: x["provider_id"].astype(str)
                                       + "_" + x["payer_id"].astype(str)
                                       + "_" + x["network_type"].astype(str))
    .groupby('payer_id')
    .agg({
        'provider_id': 'nunique'
    })
    .sort_values('provider_id', ascending=False)
)
print(df_summary.to_markdown())

# %%
import seaborn as sns
import matplotlib.pyplot as plt
sns.set_theme(style='whitegrid', rc={'figure.figsize': (14, 12)})
ax = sns.boxplot(
    data=df.loc[
        df['payer_id'].isin(df_summary.head(10).index)
    ].sort_values('health_system_name'),
    x='payer_id',
    y='federal_portion_ratio'
)
ax.set_title('Federal Portion Ratio by Health System')
ax.set_xlabel('Health System')
ax.set_ylabel('Federal Portion Ratio')
ax.set_ylim(0, 2)  # Set y-axis limits
plt.xticks(rotation=45)
plt.tight_layout()

# %%
import seaborn as sns
import matplotlib.pyplot as plt
sns.set_theme(style='whitegrid', rc={'figure.figsize': (14, 12)})
ax = sns.boxplot(
    data=df.loc[
        df['health_system_name'].isin(df['health_system_name'].sample(10, random_state=4))
    ].sort_values('health_system_name'),
    x='health_system_name',
    y='federal_portion_ratio'
)
ax.set_title('Federal Portion Ratio by Health System')
ax.set_xlabel('Health System')
ax.set_ylabel('Federal Portion Ratio')
ax.set_ylim(0, 2)  # Set y-axis limits
plt.xticks(rotation=45)
plt.tight_layout()
# %%