Gross Charge Adjustments
When gross charges are missing, we impute gross charges using the geographic medians and an adjustment factor.
Currently, the adjustment factor is calculated using Medicare Cost Report cost-to-charge ratios. The problem is that these adjustment factors can be very high for some providers and yield unbelievable gross charges.
We are exploring alternatives:
- derive provider-to-geo relativity factors where provider has some posted gross charges
- CMI
Gross Charge Availability
- 23% of providers have at least one inpatient gross charge posted in MRF files
- 76% of providers have at least one outpatient gross charge posted in MRF files
Code
df = pd.read_sql(f"""
SELECT
    provider_id,
    bill_type,
    COUNT(
        DISTINCT
        CASE
            WHEN mrf_gross_charge_provider IS NOT NULL
            THEN billing_code
            ELSE NULL
        END
    ) AS mrf_gross_charge_count,
    COUNT(
        DISTINCT
        CASE
            WHEN komodo_gross_charge_provider IS NOT NULL
            THEN billing_code
            ELSE NULL
        END
    ) AS komodo_gross_charge_count
FROM tq_dev.internal_dev_csong_cld_v2_4_0.tmp_int_combined_2025_11
WHERE provider_type = 'Hospital'
AND provider_subtype = 'Short Term Acute Care Hospital'
AND billing_code_type IN ('MS-DRG', 'HCPCS')
GROUP BY 1,2
""", con=trino_conn)
df

# %%
df_inpatient = df.loc[df['bill_type']=='Inpatient'].copy()
(df_inpatient['mrf_gross_charge_count']> 0).mean()


# %%
df_outpatient = df.loc[df['bill_type']=='Outpatient'].copy()
(df_outpatient['mrf_gross_charge_count']> 0).mean()
Gross Charge Relativities
Inpatient
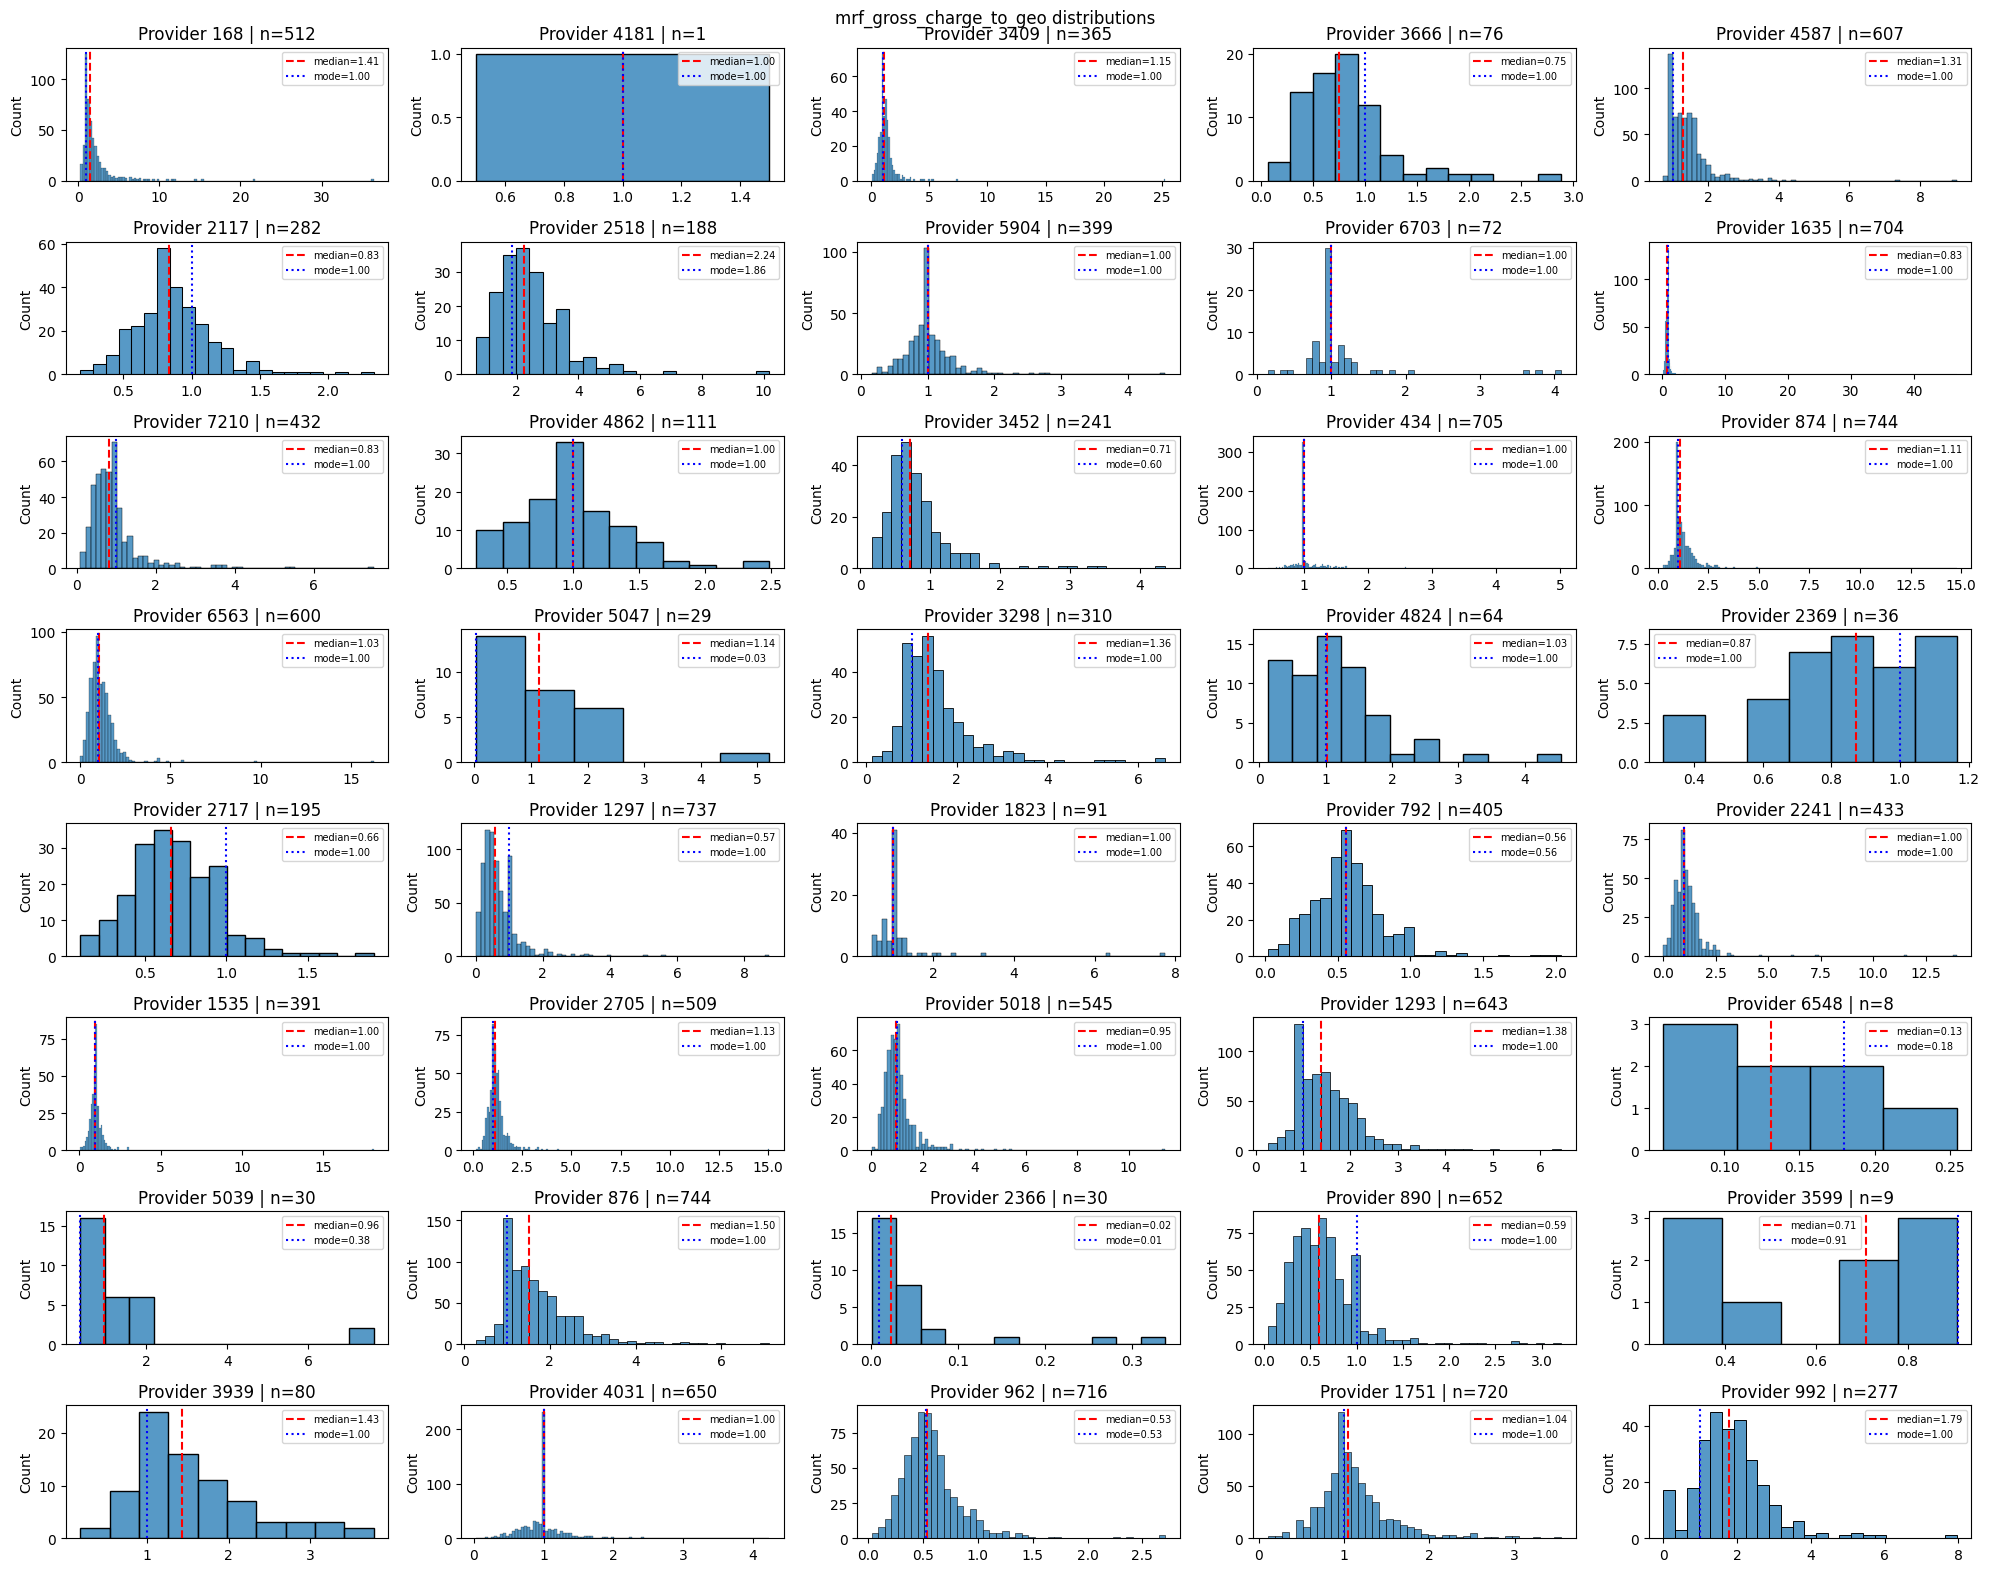
For the 23% of providers with at least one inpatient gross charge, we can calculate their gross charge relativities to the geographic median. We can then use these relativities to impute gross charges for inpatient billing codes that are missing gross charges.
Here is a random sample of 40 providers. Each distribution represents the distribution of gross charge relativities for a provider's inpatient billing codes. The vertical line represents the geographic median relativity.
Gross charge relativity is the ratio of a provider's gross charge to the state-geographic median gross charge for a billing code.
In general, as long as the sample size is large enough (greater than 40?), the median gross charge relativity would be a good metric to use for imputing missing gross charges.
Code
# %%
sample_providers = pd.read_sql(f"""
SELECT DISTINCT provider_id
FROM (
    SELECT *
    FROM tq_dev.internal_dev_csong_cld_v2_4_0.tmp_int_combined_2025_11
    WHERE provider_type = 'Hospital'
    AND provider_subtype = 'Short Term Acute Care Hospital'
    AND mrf_gross_charge_provider IS NOT NULL
    AND bill_type = 'Inpatient'
    ORDER BY provider_name ASC
)
""", con=trino_conn).sample(100, random_state=42)['provider_id'].tolist()

# %%
df = pd.read_sql(f"""
WITH
df AS (
    SELECT
        DISTINCT
        provider_id,
        cmi,
        bill_type,
        billing_code_type,
        billing_code,
        mrf_gross_charge_provider,
        komodo_gross_charge_provider,
        mrf_gross_charge_cbsa_median,
        mrf_gross_charge_state_median,
        komodo_gross_charge_cbsa_median,
        komodo_gross_charge_state_median,
        gross_charge_state_provider_adjustment
    FROM tq_dev.internal_dev_csong_cld_v2_4_0.tmp_int_combined_2025_11 df
    WHERE provider_id IN ('{"', '".join([str(x) for x in sample_providers])}')
    AND bill_type = 'Inpatient'
    AND billing_code_type = 'MS-DRG'
)
SELECT *
FROM df
""", con=trino_conn)
df

# %%
df['mrf_gross_charge_to_geo'] = df['mrf_gross_charge_provider'] / df['mrf_gross_charge_state_median']

# %%
fig, axes = plt.subplots(8, 5, figsize=(20, 16))
np.random.seed(42)
random_providers = np.random.choice(sample_providers, size=40, replace=False)
for i, (ax, pid) in enumerate(zip(axes.flatten(), random_providers)):
    subset = df.loc[df['provider_id']==pid, 'mrf_gross_charge_to_geo'].dropna()
    sns.histplot(subset, ax=ax)
    med = subset.median()
    mode = round(subset,2).mode().iloc[0] if not round(subset,2).mode().empty else None
    ax.axvline(med, color='red', linestyle='--', label=f'median={med:.2f}')
    if mode is not None:
        ax.axvline(mode, color='blue', linestyle=':', label=f'mode={mode:.2f}')
    ax.legend(fontsize=7)
    ax.set_title(f'Provider {pid} | n={len(subset)}')
    ax.set_xlabel('')
fig.suptitle('mrf_gross_charge_to_geo distributions')
fig.tight_layout()
Interestingly, this metric relatively is totally uncorrelated with CMI:
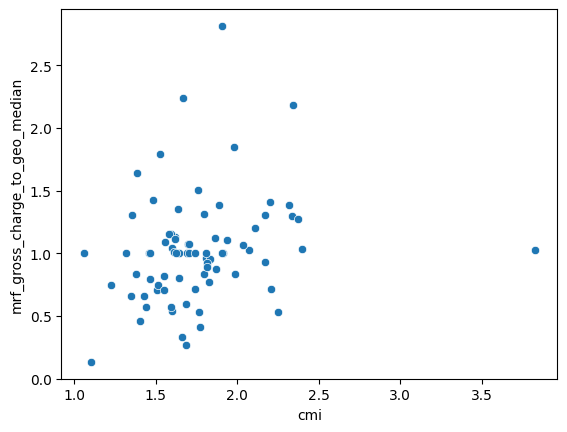
| cmi | mrf_gross_charge_to_geo_median | gross_charge_state_provider_adjustment | |
|---|---|---|---|
| cmi | 1 | 0.226576 | 0.51829 |
| mrf_gross_charge_to_geo_median | 0.226576 | 1 | 0.545949 |
| gross_charge_state_provider_adjustment | 0.51829 | 0.545949 | 1 |
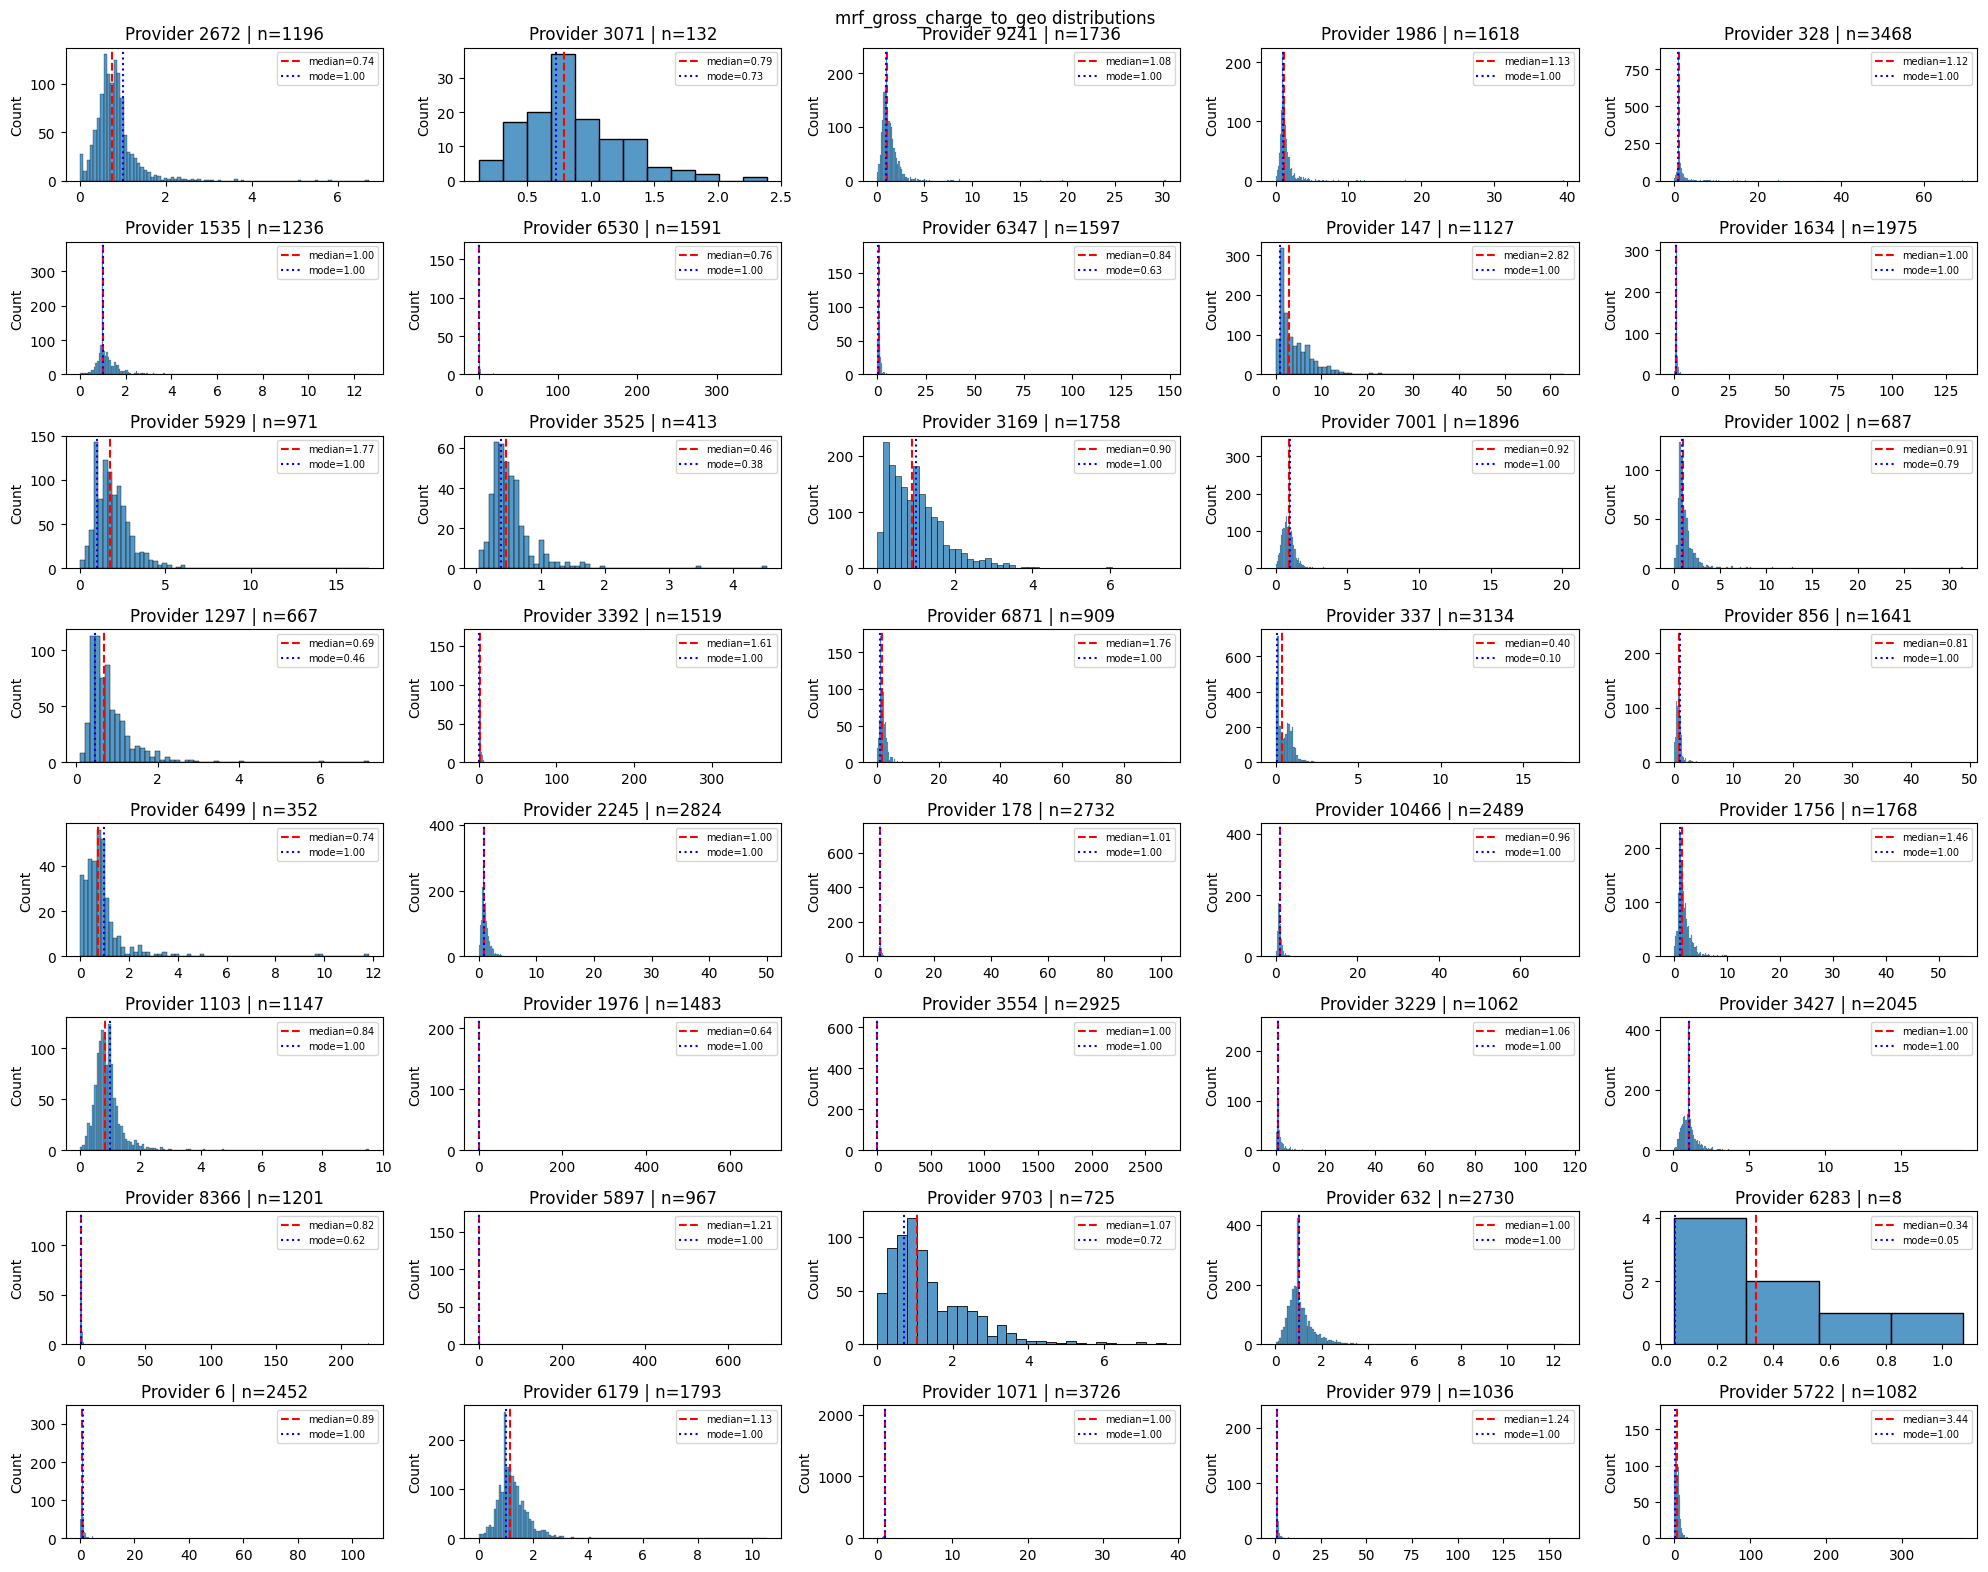
Outpatient
Code
# %% [markdown]
"""
Analysis: Outpatient
"""

# %%
sample_providers = pd.read_sql(f"""
SELECT DISTINCT provider_id
FROM (
    SELECT *
    FROM tq_dev.internal_dev_csong_cld_v2_4_0.tmp_int_combined_2025_11
    WHERE provider_type = 'Hospital'
    AND provider_subtype = 'Short Term Acute Care Hospital'
    AND mrf_gross_charge_provider IS NOT NULL
    AND bill_type = 'Outpatient'
    ORDER BY provider_name ASC
)
""", con=trino_conn).sample(40, random_state=42)['provider_id'].tolist()

# %%
df = pd.read_sql(f"""
WITH
df AS (
    SELECT
        DISTINCT
        provider_id,
        cmi,
        bill_type,
        billing_code_type,
        billing_code,
        mrf_gross_charge_provider,
        komodo_gross_charge_provider,
        mrf_gross_charge_cbsa_median,
        mrf_gross_charge_state_median,
        komodo_gross_charge_cbsa_median,
        komodo_gross_charge_state_median,
        gross_charge_state_provider_adjustment
    FROM tq_dev.internal_dev_csong_cld_v2_4_0.tmp_int_combined_2025_11 df
    WHERE provider_id IN ('{"', '".join([str(x) for x in sample_providers])}')
    AND bill_type = 'Outpatient'
    AND billing_code_type = 'HCPCS'
)
SELECT *
FROM df
""", con=trino_conn)
df

# %%
df['mrf_gross_charge_to_geo'] = df['mrf_gross_charge_provider'] / df['mrf_gross_charge_state_median']

# %%
fig, axes = plt.subplots(8, 5, figsize=(20, 16))
np.random.seed(42)
random_providers = np.random.choice(sample_providers, size=40, replace=False)
for i, (ax, pid) in enumerate(zip(axes.flatten(), random_providers)):
    subset = df.loc[df['provider_id']==pid, 'mrf_gross_charge_to_geo'].dropna()
    sns.histplot(subset, ax=ax)
    med = subset.median()
    mode = round(subset,2).mode().iloc[0] if not round(subset,2).mode().empty else None
    ax.axvline(med, color='red', linestyle='--', label=f'median={med:.2f}')
    if mode is not None:
        ax.axvline(mode, color='blue', linestyle=':', label=f'mode={mode:.2f}')
    ax.legend(fontsize=7)
    ax.set_title(f'Provider {pid} | n={len(subset)}')
    ax.set_xlabel('')
fig.suptitle('mrf_gross_charge_to_geo distributions')
fig.tight_layout()
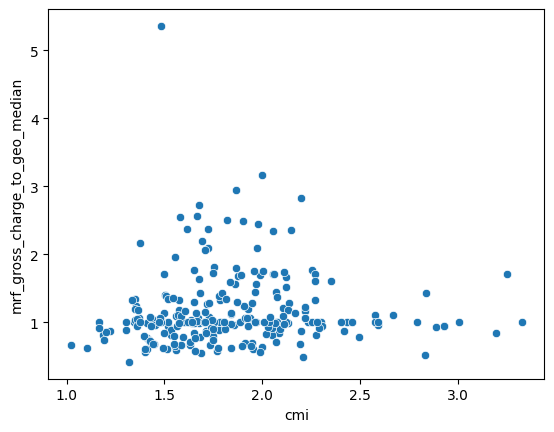
| cmi | mrf_gross_charge_to_geo_median | gross_charge_state_provider_adjustment_median | |
|---|---|---|---|
| cmi | 1 | 0.0825386 | 0.437462 |
| mrf_gross_charge_to_geo_median | 0.0825386 | 1 | 0.322083 |
| gross_charge_state_provider_adjustment_median | 0.437462 | 0.322083 | 1 |