Analyses
Analysis of tq_dev.internal_dev_mmalhotra_provisions.provisions_stoploss_aggregated_2026_01. Note that these are purely to drive targeted QA based on expected values.
Question 1: Which rates don't make sense based on distribution?
1a. How are dollar thresholds distributed?
Distribution of dollar_threshold across all non-null records.
SQL
select
    count(*)
    ,min(dollar_threshold) as min
    ,approx_percentile(dollar_threshold, 0.05) as p5
    ,approx_percentile(dollar_threshold, 0.25) as p25
    ,approx_percentile(dollar_threshold, 0.50) as p50
    ,approx_percentile(dollar_threshold, 0.75) as p75
    ,approx_percentile(dollar_threshold, 0.90) as p90
    ,approx_percentile(dollar_threshold, 0.95) as p95
    ,approx_percentile(dollar_threshold, 0.99) as p99
    ,max(dollar_threshold) as max
from tq_dev.internal_dev_mmalhotra_provisions.provisions_stoploss_aggregated_2026_01
where dollar_threshold is not null
| count | 6,883 |
| min | $0 |
| p5 | $12,799 |
| p25 | $78,609 |
| p50 | $173,163 |
| p75 | $339,741 |
| p90 | $615,899 |
| p95 | $840,287 |
| p99 | $1,231,200 |
| max | $274,275,276,278,290 |
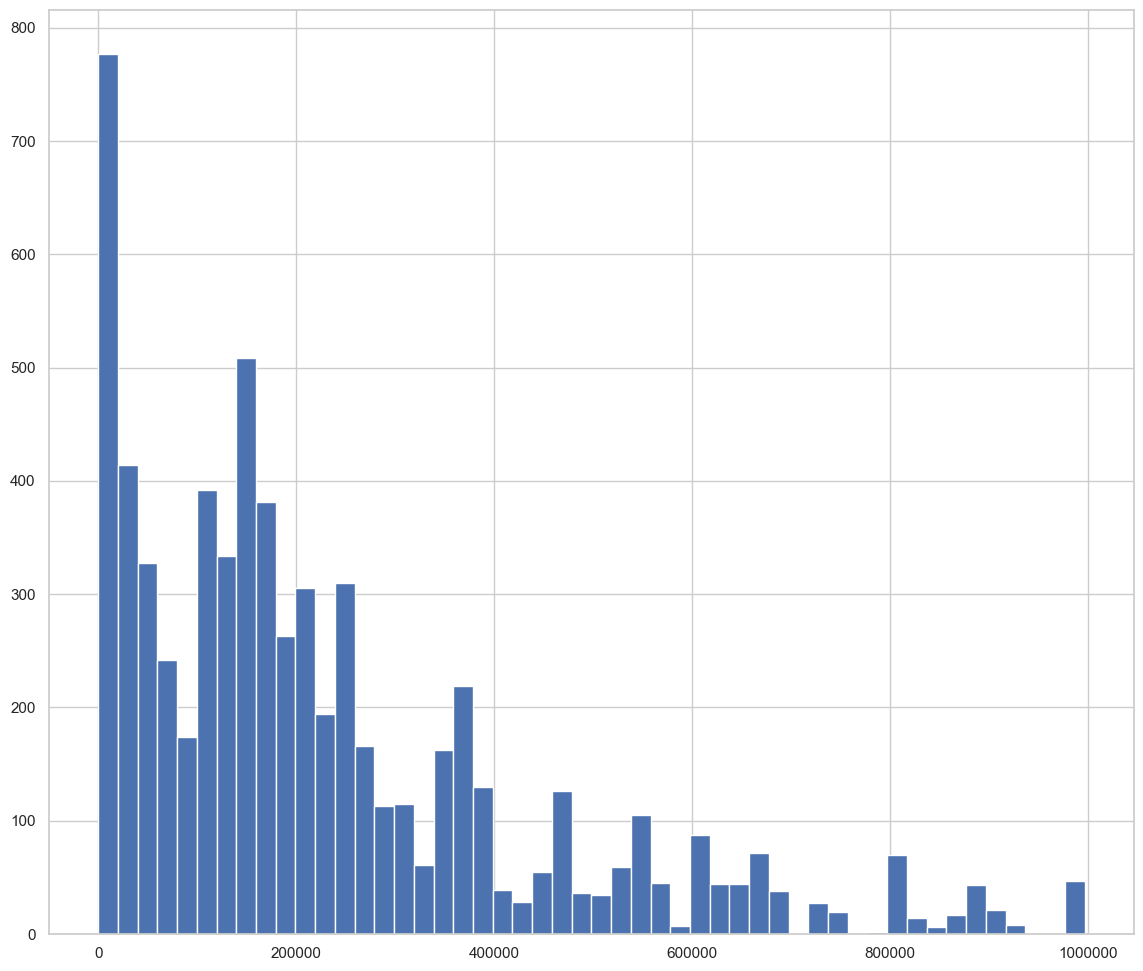
Answer: The median threshold is about 173K and the core of the distribution sits between 100K–400K, which is a reasonable range for stoploss provisions. However, the histogram shows a large spike near 0 (about 775 records) that is clearly not valid. These were researched and exclusion rules were added to improve capture. The distribution also shows distinct round-number clusters at common contracted amounts (100K, 150K, 200K, 250K, 400K, 500K), which is expected. The max value (274B) is a parsing error (a concatenated list of revenue codes) and is excluded from the histogram.
1b. How are percentage reimbursements distributed?
Distribution of percentage_reimbursement across all non-null records.
| count | 8,928 |
| min | 0% |
| p5 | 14% |
| p25 | 30% |
| p50 | 48% |
| p75 | 67% |
| p90 | 100% |
| p95 | 104% |
| p99 | 203% |
| max | 11,876% |
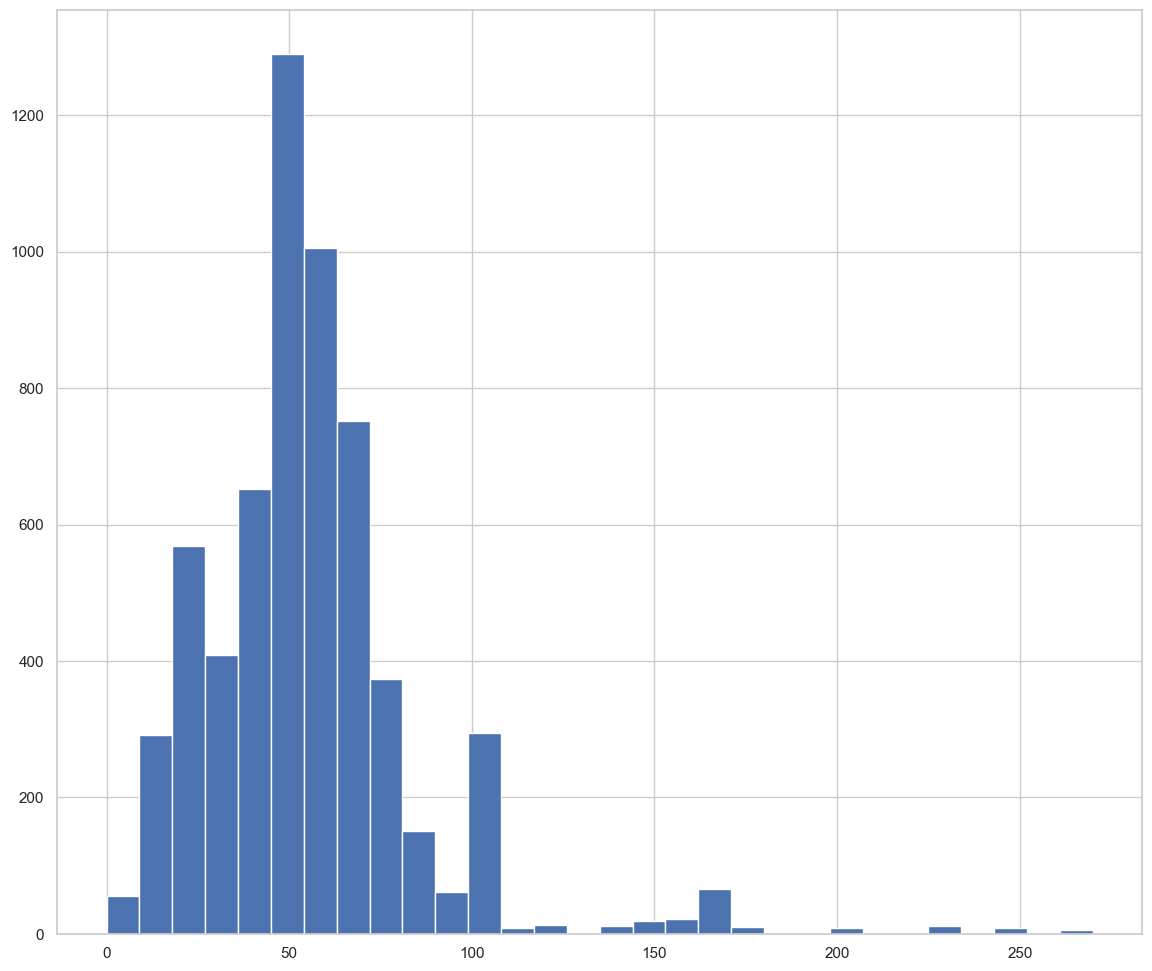
Answer: The core distribution (p5–p75: 14%–67%) looks reasonable for stoploss reimbursement rates. However, values above 100% are clearly wrong. The p99 of 203% and max of 11,876% indicate parsing issues that need to be researched. The p90 landing exactly at 100% suggests a meaningful number of records are right at the boundary.
Question 2: Are percentage reimbursement and dollar threshold correlated?
Scatter plot of percentage_reimbursement vs dollar_threshold to check for correlation between the two fields.
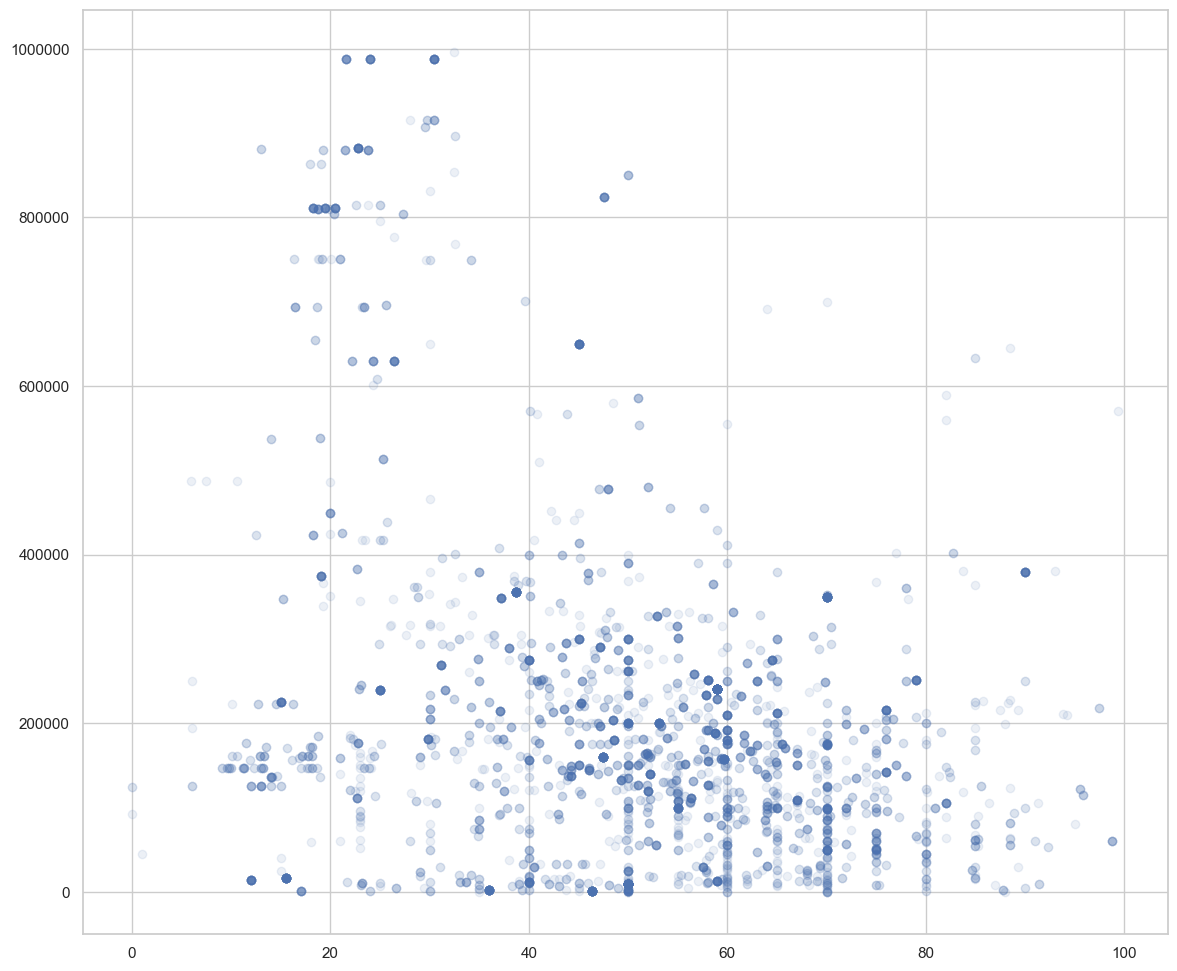
Answer: There is a very faint inverse relationship, but this should be reassessed once data quality improves.