OP - RA.0.qMRI
CM Codes
Data Overview
1996 total codes in komodo_rii; 3 retained after n_claims > 500 filter.
| CMS severity | n codes |
|---|---|
| No CC/MCC | 3 |
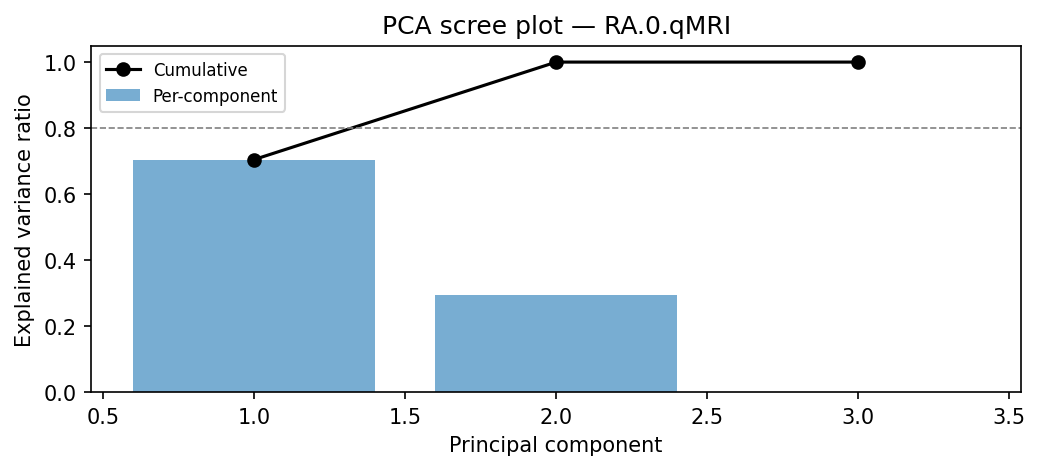
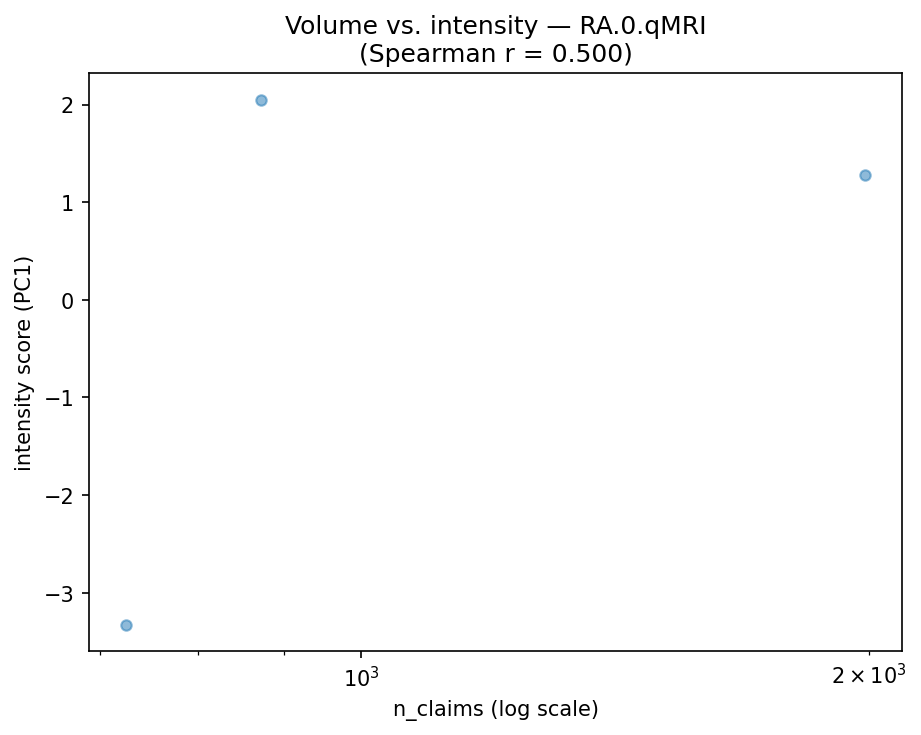
PCA Analysis
PC1 explains 70.5% of variance; PC1+PC2 together explain 100.0%.
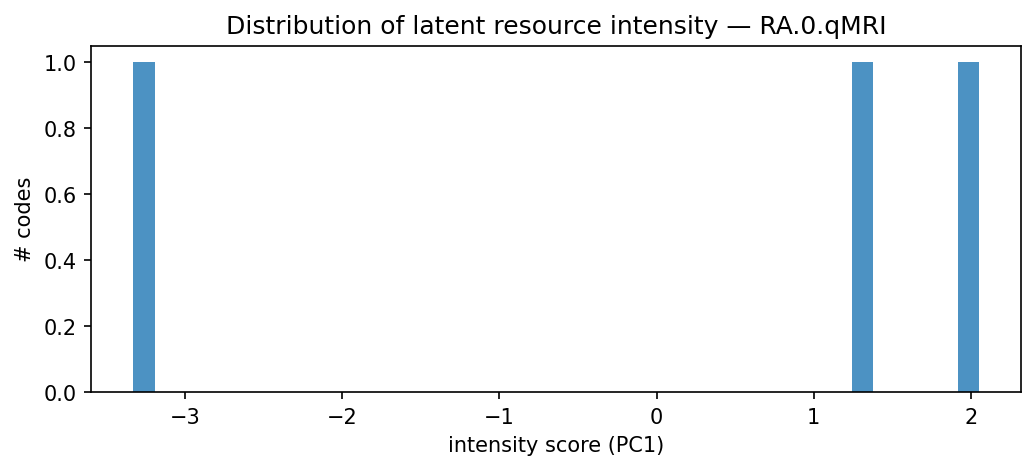
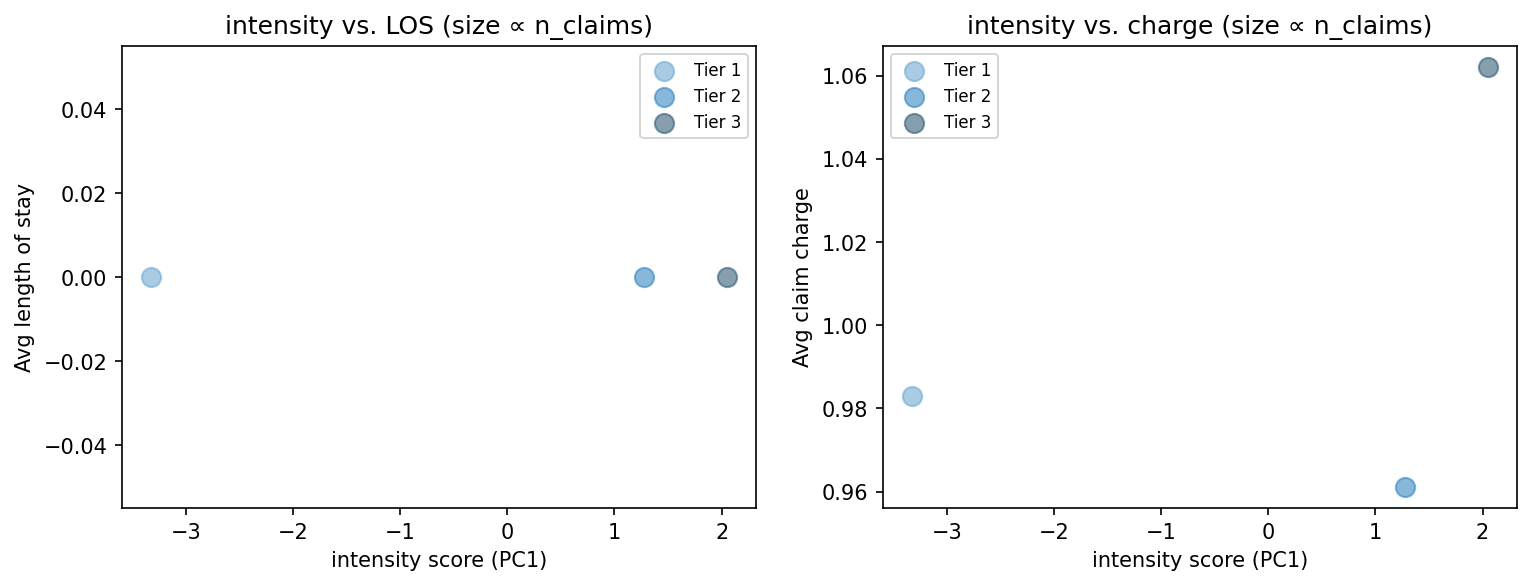
Tier Clustering (k=3)

Tier Summary
| tier | n_codes | n_claims | n distinct rev codes | work rvu | n j code lines | n imaging lines | organ system count | n distinct hcps | relative claim charge | transfusion |
|---|---|---|---|---|---|---|---|---|---|---|
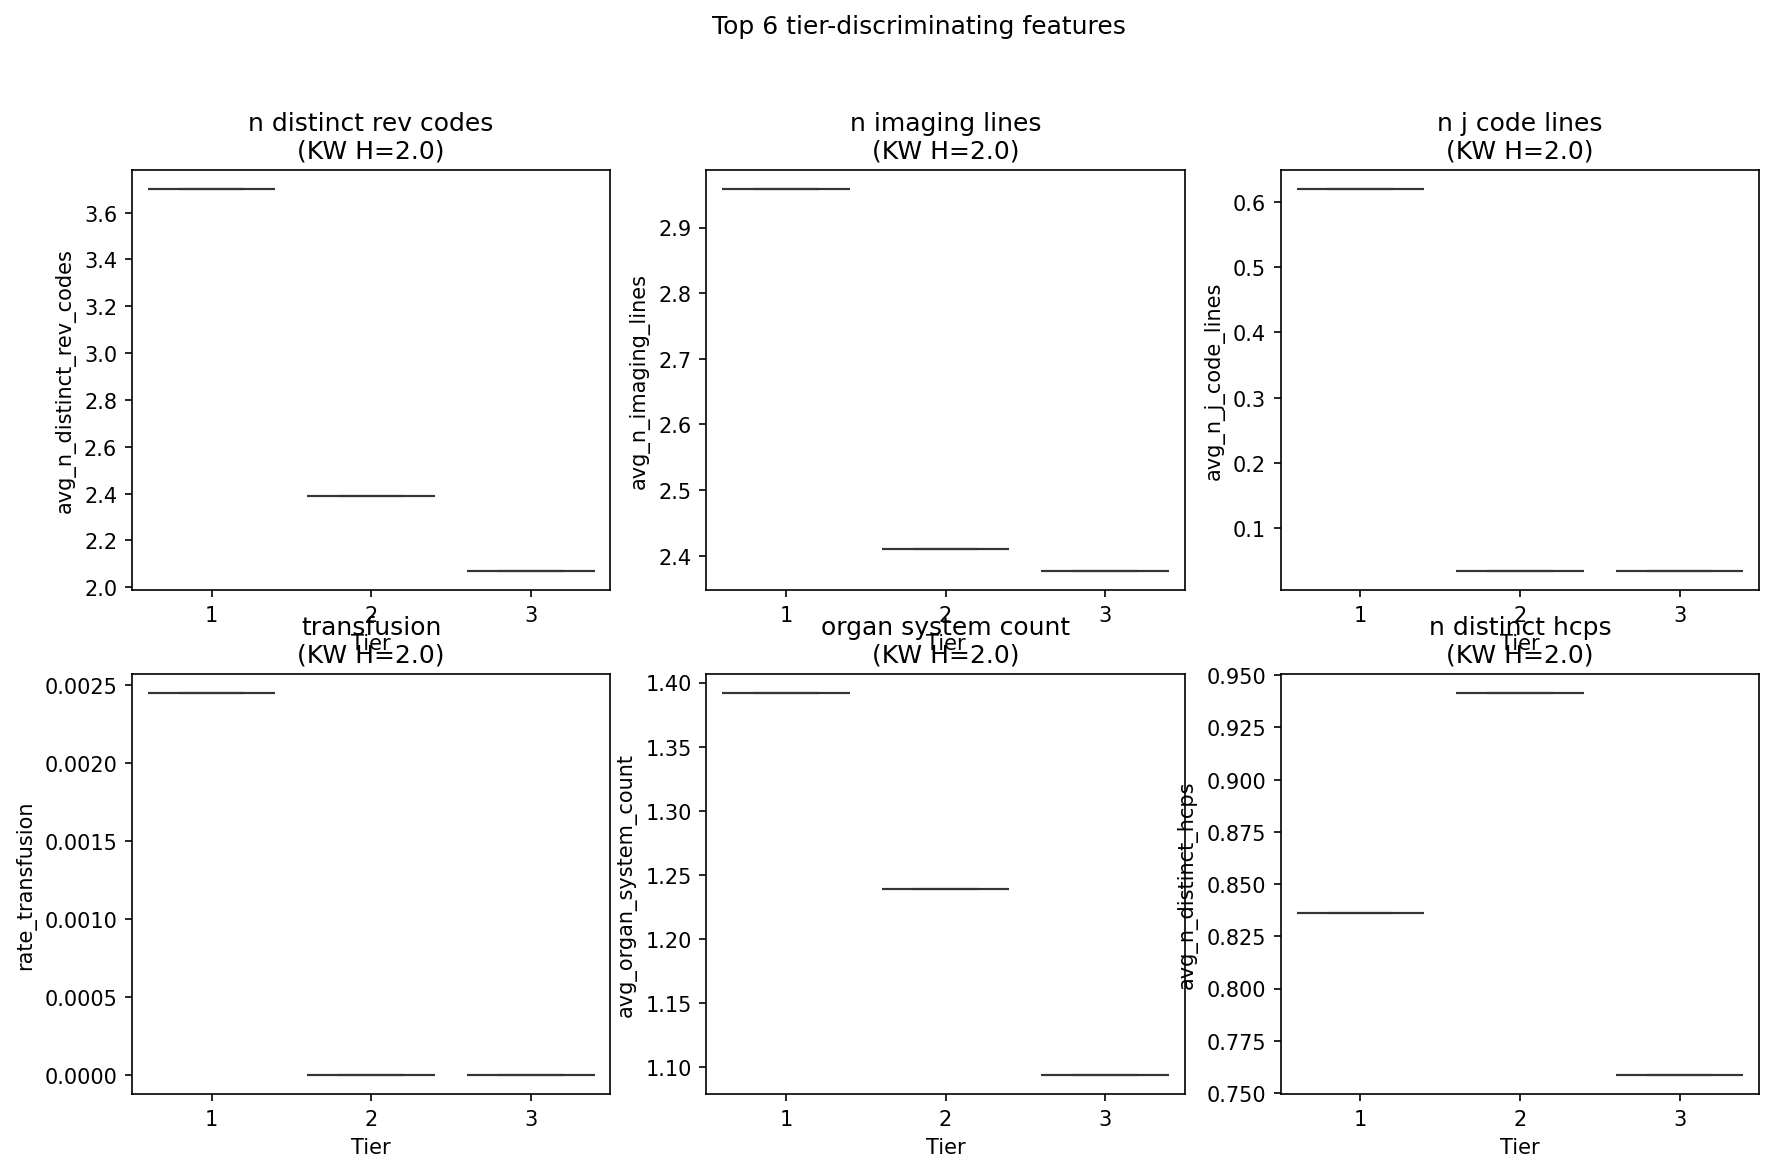
| 1 | 1.000 | 725.000 | 3.700 | 3.215 | 0.619 | 2.958 | 1.392 | 0.836 | 0.983 | 0.002 |
| 2 | 1.000 | 1990.000 | 2.388 | 1.869 | 0.035 | 2.410 | 1.239 | 0.941 | 0.961 | 0.000 |
| 3 | 1.000 | 872.000 | 2.070 | 2.542 | 0.034 | 2.377 | 1.094 | 0.759 | 1.062 | 0.000 |
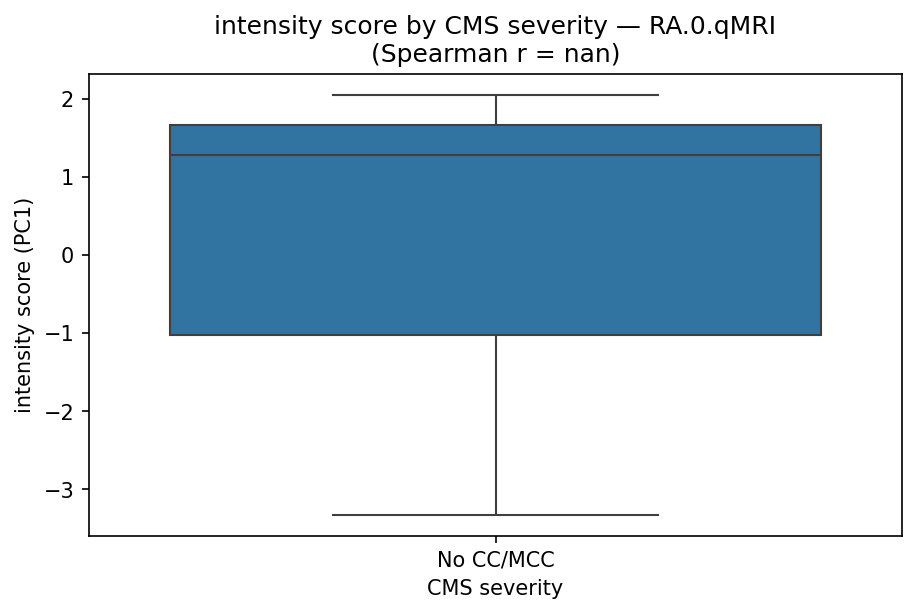
CMS Severity × intensity Tier
| cms_severity | Tier 1 | Tier 2 | Tier 3 | All |
|---|---|---|---|---|
| No CC/MCC | 1 | 1 | 1 | 3 |
| All | 1 | 1 | 1 | 3 |
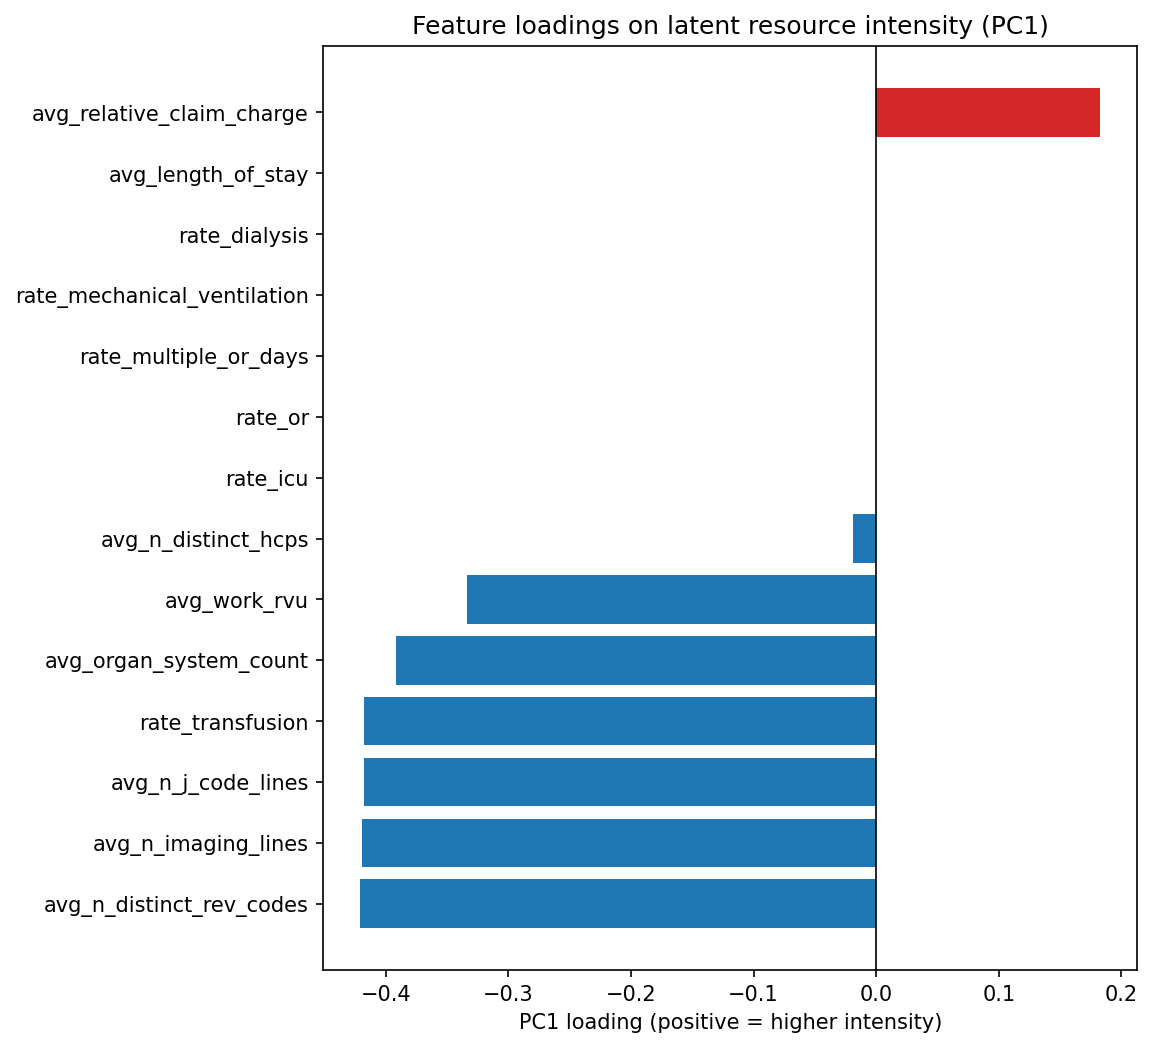
Feature Analysis
Feature Correlation
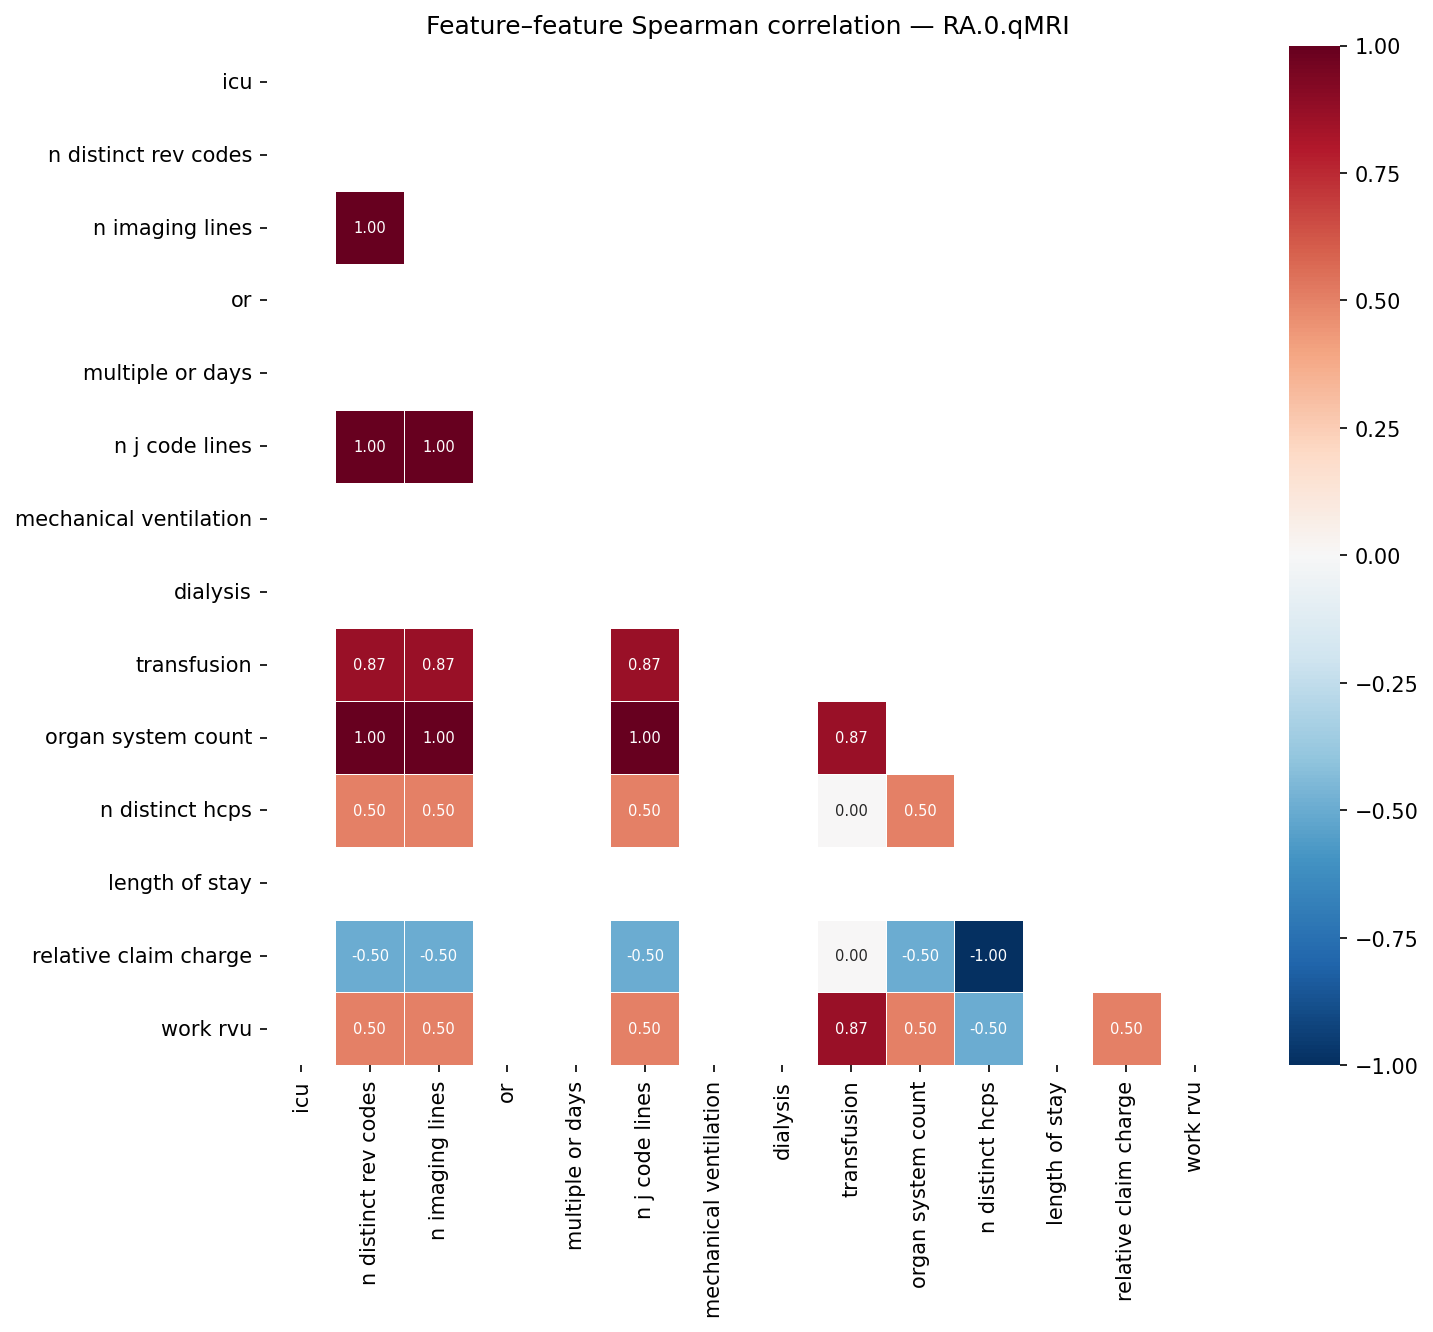
Feature Audit
| pc1_loading | r_with_volume | r_with_severity | |
|---|---|---|---|
| avg_relative_claim_charge | 0.183 | -0.500 | nan |
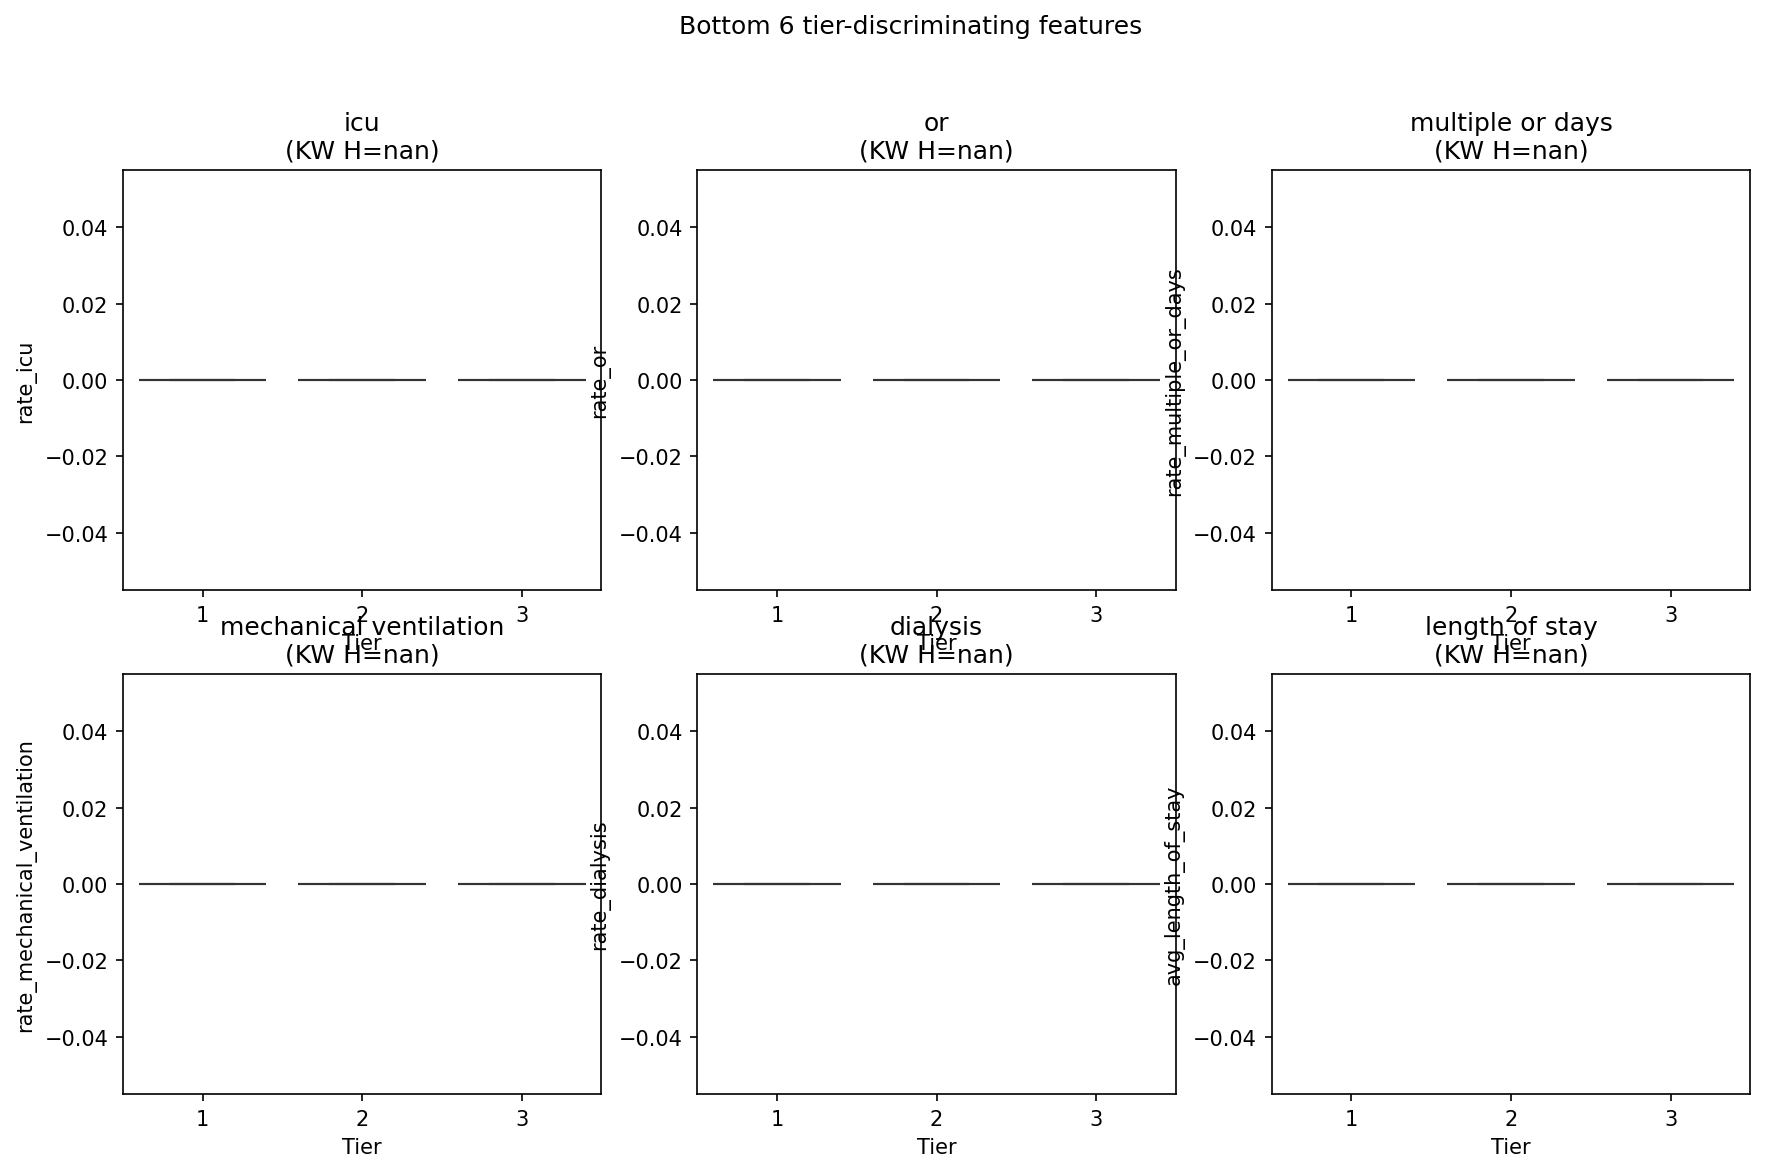
| avg_length_of_stay | 0.000 | nan | nan |
| rate_dialysis | 0.000 | nan | nan |
| rate_icu | -0.000 | nan | nan |
| rate_mechanical_ventilation | 0.000 | nan | nan |
| rate_multiple_or_days | 0.000 | nan | nan |
| rate_or | 0.000 | nan | nan |
| avg_n_distinct_hcps | -0.019 | 0.500 | nan |
| avg_work_rvu | -0.333 | -1.000 | nan |
| avg_organ_system_count | -0.392 | -0.500 | nan |
| avg_n_j_code_lines | -0.417 | -0.500 | nan |
| rate_transfusion | -0.417 | -0.866 | nan |
| avg_n_imaging_lines | -0.420 | -0.500 | nan |
| avg_n_distinct_rev_codes | -0.421 | -0.500 | nan |
Top 6 Tier-Discriminating Features
Bottom 6 Tier-Discriminating Features
Score Validation
Misclassification Audit (N=10 samples)
Over-tiered: Tier 3, No CC/MCC (1 codes)
| code | code_description | cms_severity | intensity_score | tier | n_claims | key_drivers |
|---|---|---|---|---|---|---|
| G35 | None | No CC/MCC | 2.050 | 3 | 872 | organ system count (+0.48), n distinct rev codes (+0.39), n imaging lines (+0.32) |
Under-tiered: Tier 1, MCC (0 codes)
None.
Top Codes by Tier
Tier 1 (n=1 codes)
| code | Description | CMS severity | Score | N claims | Key drivers |
|---|---|---|---|---|---|
| I517 | Cardiomegaly | No CC/MCC | -3.328 | 725 | n imaging lines (-0.59), n j code lines (-0.59), transfusion (-0.59) |
Tier 2 (n=1 codes)
| code | Description | CMS severity | Score | N claims | Key drivers |
|---|---|---|---|---|---|
| G3184 | Mild cognitive impairment of uncertain or unknown etiology | No CC/MCC | 1.278 | 1990 | work rvu (+0.41), transfusion (+0.30), n j code lines (+0.29) |
Tier 3 (n=1 codes)
| code | Description | CMS severity | Score | N claims | Key drivers |
|---|---|---|---|---|---|
| G35 | None | No CC/MCC | 2.050 | 872 | organ system count (+0.48), n distinct rev codes (+0.39), n imaging lines (+0.32) |
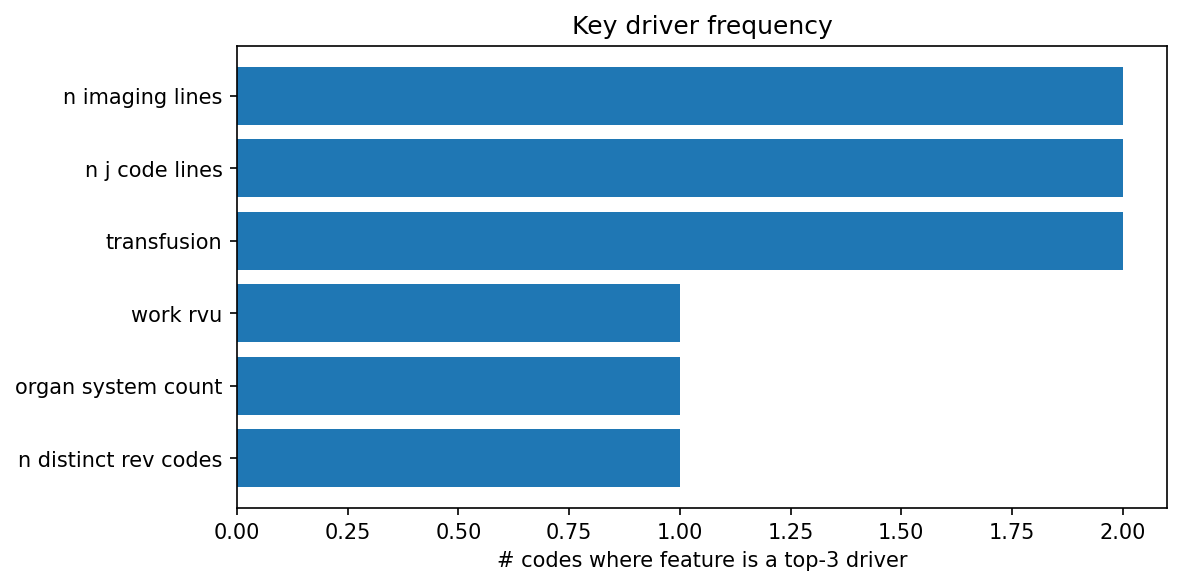
Key Driver Frequency
| feature | count | pct |
|---|---|---|
| n imaging lines | 2 | 66.700 |
| n j code lines | 2 | 66.700 |
| transfusion | 2 | 66.700 |
| work rvu | 1 | 33.300 |
| organ system count | 1 | 33.300 |
| n distinct rev codes | 1 | 33.300 |